Lessons learned from debunking a marketing myth we all swallowed without sniffing.
 Gregg Blanchard /

A couple years ago Blue Hornet published a bit of research that indicated 80% of recipients, if they feel a mobile email “doesn’t look good” on their device, will delete it and 30% would unsubscribe.
It was a startling stat, right? And it didn’t take long before the stat started to be changed ever so slightly. Like a classic game of telephone it went from “said they delete”…
80% of people surveyed said they delete an email that doesn't look good on mobile: Responsive Email Design http://t.co/nkHeO924Q3
— 3in1 Communications (@3in1comm) June 9, 2014
…to just “delete”…
80% of people delete your email if it doesn't look good @meladorri #searchlove
— Ivy Pollock (@ivypollock) September 11, 2014
…to “will immediately delete” (as if they’d wait around for a few minutes before doing so)…
Did you know that 80% of people will immediately delete your email if it looks bad? It's true! Are the emails you… http://t.co/Pjo1aE8eAY
— geekfarm(@opgeekfarm) September 3, 2014
…to this ALSO impacting non-responsive emails…
80% of people delete an email that doesn't look good or isn't responsive on mobile. #bbcon
— Chelsea Nelson (@NoshMaven) October 7, 2014
…to this impacting ONLY non-responsive emails…
80% of people will delete an email if it's not responsive to the device they're opening it. 18% of those will unsubscribe. #AdobeSummit
— Sara Beth Jones (@jonesysb) March 12, 2015
…or, as one group put it, unoptimized.
80% delete unoptimized#email; "Howto Optimize Your Emails for #Mobile: A Beginner's Guide" http://t.co/Z3K4VAv22e by @lozzzytweets
— Modgility(@modgility) June 24, 2014
But having a wee bit of data at my fingertips, I decided to dig deeper. When it didn’t pass the sniff test, I started from the beginning to see if this stat held any water.
Here’s how it went.
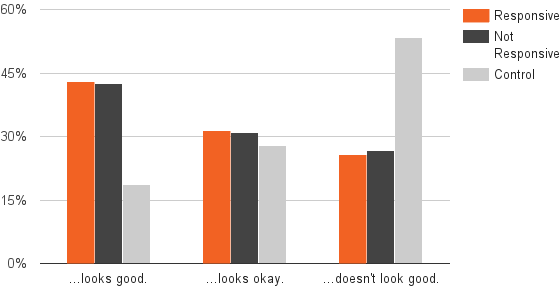
“Doesn’t Look Good” & Doesn’t Actually Act
First I built a survey, gathered 1,200 responses, and found that 25% of people think email templates look bad. Interestingly, responsiveness played almost no role in whether or not they were labeled as such.
Then, I found that even though the data predict 3% opt-out rates, actual opt-out rates were normal at 0.23%.
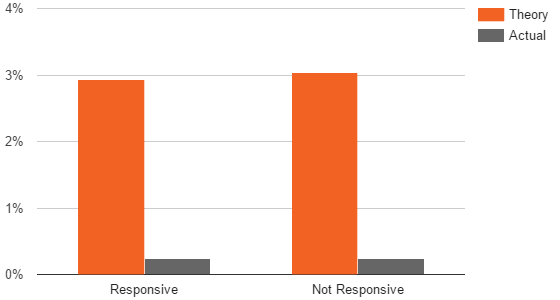
In other words, there was a massive gap between what we thought people were doing and what they actually were.
Three Lessons
I’ve been watching this stat develop for a while and have seen many marketers basing decisions off these data points, so let me recap this process with three, simple takeaways:
- If you see a stat, find the source – the context – it was originally shared in. What question were they trying to answer? What was the exact working of the survey question? etc.
- Self-reported behavior is VERY different from self-reported theoretical behavior. In other words, there’s a big difference between asking what someone “did” and what they “would do”
- If you’re going to base a decision on a stat, always dig deeper and ask questions.
There are so many marketing stats tossed around these days. I should know, I publish at least one every week.
But before you base decisions of anyone’s, including mine, make sure to give it a closer look because, more often than not (at least in my experience, you’re gonna find that things aren’t quite as simple as the stat was intended to seem.
And if you don’t have the data to do so, let me know and I’ll do the digging for you.