Social Media
EpicMix Autotweets: A By-the-Numbers Analysis of Vail Resorts’ Guests Sharing Their Moments


BLANCHARD
I’ve talked often about EpicMix. One of the pieces I’ve referred to most often in recent months is the sharing aspect of the platform.
The fact that it not just gamifies skiing and breaks up the sport into piece of measurable content, but that the whole thing is designed to automate (or at least facilitate) the sharing of this content.
But how do these tweet perform? And how do they compare? Let’s take a look, setting the stage with generic numbers and then giving them some context using EpicMix tweets posted directly from the EpicMix system during the first three weeks of the year (Jan 1 – Jan 21).
#1) Tweet Volume
For the 21 days I looked at, I saw a total of 11,718 tweets posted from the EpicMix system or roughly 558 tweets a day.
#2) Tweet Reach
In that same time, Vail Resorts accounts (with EpicMix, so Park City is not included) posted a total of 688 times combined. So how did their TOTAL reach compare?
NOTE: I did not count retweets of either EpicMix tweets or resort tweets in these reach numbers. This is only 1st level, direct reach.
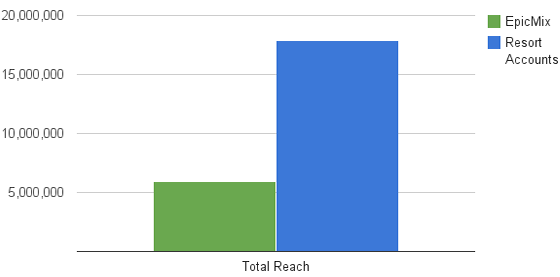
Over those 21 days, the TOTAL reach for the resort accounts was almost exactly 3x as much as the EpicMix tweets.
But a big piece of the value such tweets create is the new eyeballs that see these messages. So, how did UNIQUE reach look? Here it is:
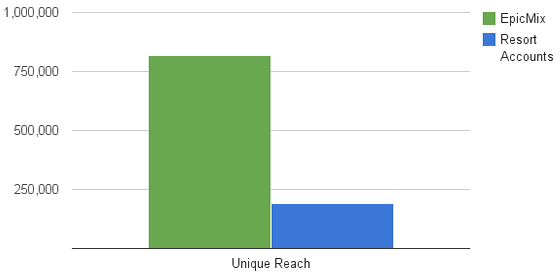
EpicMix tweets had the potential to reach over 819,000 unique eyeballs – over 4x as many as the resort accounts (190,000).
#3) Tweet Engagement
But what about engagement. Wanting to see how these tweets compared to other tweets posted by those same skiers during those 21 days, I did that just. Here’s how the results shook out.
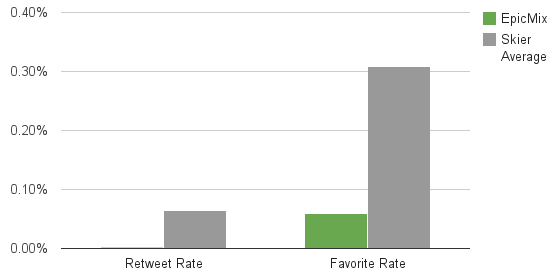
While overall, these tweets recieved much less engagement than those skiers’ typical tweets, what’s most interesting to me is that retweets were almost non-existant – 0.002%.
For context, the average favorite rate for resort tweets during that stretch was almost identical to EpicMix tweets – 0.06% – but the average retweet rate for resorts was 2.85%, over 1000x higher. In other words, their followers don’t mind VR skiers tweeting their stories, but there’s no real reason to share it themselves as there is with other content.
A Quick Recap
So, what have we learned.
- EpicMix tweets increase Vail Resorts’ unique reach by 4x.
- Overall, however, resort tweets still account for 3x as much total reach.
- These tweets are much less engaging than the other tweets these skiers post.
- They see similar favorite rates as resort tweets, but virtually no retweets.
Keep in mind another x-factor: authenticity. True, automation rules the day, but because these are coming through personal accounts rather than brand accounts, there’s a piece here that could play a big role that’s virtually impossible to measure.
The results, to me, are impressive. They don’t tell the story of a perfect marketing system, but in terms of tapping into the massive reach within your guests’ follower counts, EpicMix appears to be heading the right direction.
About Gregg & SlopeFillers
I've had more first-time visitors lately, so adding a quick "about" section. I started SlopeFillers in 2010
with the simple goal of sharing great resort marketing strategies. Today I run marketing for resort ecommerce and CRM provider
Inntopia,
my home mountain is the lovely Nordic Valley,
and my favorite marketing campaign remains the Ski Utah TV show that sold me on skiing as a kid in the 90s.
Get the weekly digest.
New stories, ideas, and jobs delivered to your inbox every Friday morning.